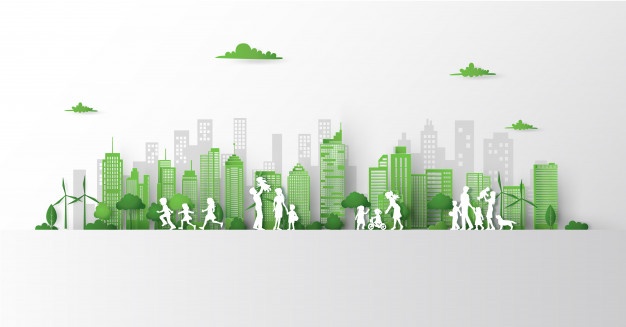
LIVEABLE CITIES
Liveable cities are an urban system that
contributes to the physical, social and mental well being and personal
development of its inhabitants. Key principles that gives substance to them are
equity, dignity, accessibility, participation and empowerment. Liveability is a
sum of factors that add up to a community quality of life including built and
natural environment, economic prosperity, social stability, and equity,
educational opportunities, cultural entertainment and recreation possibilities.
The
Government of India along with the various state and Local Governments is
implementing several flagship Urban Missions. An overarching goal of the
various missions and schemes is to make Indian cities more ‘Liveable’. In 2019
the Ministry of Urban Development has developed a set of ‘Liveability standards
in Cities’ to measure the quality of life in 116 major cities including capital
cities and those with population over one million. Liveability Index for Indian
Cities by Ministry of Urban Development are as follows,
1)
Institutional:
a)
Government Index:
· Percentage
of citizen services available online: The extent to which,
various citizen services can be accessed by citizens remotely, through online
portals, phone applications, e-kiosks etc. Citizen services will include
various online payments of taxes and charges, applications and approvals,
grievance management, issue of documents like birth and death certificates etc.
·
Tax collected as percentage of tax
billed: This denotes the efficiency achieved by a city in
collecting property taxes against the tax demand raised in a given year. Implementation
of smart solutions in cities will be expected to improve systemic efficiencies
in issuance of regular and timely demand notices, and facilitate ease of payment,
thereby leading to improvement in collection of taxes and ULB revenues.
· Percentage
of population covered under Ward Committees/ area Sabha’s:
The participation of citizens in matters of governance, planning and
development is critical for ensuring inclusive and participatory growth of
cities.
2)
Social:
a)
Identity and culture:
· Restoration
and reuse of historic buildings: The extent to which
planning and development in the city respects historic buildings/sites and the
existing cultural landscape, through projects for preservation/restoration and
adaptive reuse.
·
Percentage of ecologically important
areas covered through projects for restoration:
The extent to which the city has taken ecologically sensitive areas (natural
heritage) into consideration during the process of planning and development. Ecologically
sensitive sites will include surface water bodies, urban watershed (natural
drainage lines), coastlines, riverfronts, wetlands and urban forests. Restoration
of such sites can lead to better sustainable development.
· Percentage
of budget allocated towards cultural/sports activities: This
indicates the focus of the City Government on encouraging cultural and sports
activities in the city. Active budgeting and expenditure by city governments on
such cultural/ sports activities can facilitate a vibrant sociocultural
environment within cities.
b)
Education:
· Percentage
of school-aged population enrolled in schools:
Education is one of the most important aspects of human development. this
indicator denotes educational opportunity, and determines the coverage of
formal education among school aged population in the city.
·
Primary education student-teacher
ratio: This denotes the availability of adequate number of
teachers in schools for providing primary education. A lower ratio indicates
better individual attention and support for students in the primary grades.
· Percentage
of students completing primary education: The ability of
the primary education system in the city to hold enrolled students until the
completion of primary education. Survival rate, particularly at the primary
level, is considered a pre-requisite for sustainable literacy.
c)
Health:
· Number
of in-patient hospital beds per 10,000 population:
This denotes the adequacy of inpatient medical infrastructure measured in the
form of availability of in-patient beds in hospitals (public and private) in
the city.
·
Period prevalence of water borne
disease: This denotes the prevalence of water borne diseases
such as cholera, typhoid, dysentery etc. in the city during a particular time
period. it is an indicator of the quality of water used for drinking, washing,
bathing etc. in the city.
· Period
prevalence of vector borne diseases: This denotes the
prevalence of vector borne diseases such as malaria, dengue, chikungunya etc.
in the city during a particular time period. It is an indicator of the measures
taken by city administrations to control the growth of mosquitoes and other
organisms that spread such diseases, and the general level of hygiene and
sanitation
d)
Safety and Security:
· Number
of streets, public places, junctions covered through surveillance systems:
The extent to which public areas such as streets, public places like transport
interchanges, government buildings, recreational spaces etc. and major traffic
junctions in the city are covered through Closed-circuit television (CCTV)
surveillance cameras.
·
Number of recorded crimes per lakh
population: This denotes the prevalent crime rate in
a city. Lower crime rates are indicative of higher levels of safety and
security in a city, due to effective surveillance in public spaces, better SOS
and crime registration systems, and police response mechanisms. Better planning
and programming of public spaces, illumination of streets, compact and active
neighbourhoods can also contribute to safer cities.
· Transport-related
fatality per lakh population: This denotes the level
of safety of transport networks in the city. Better managed transport systems
will tend to be safer and record lower transport related fatalities.
3)
Economy:
a)
Economy and Employment:
· Increase
in VAT/GST collection: This is one of the important
indicators of economic productivity and competitiveness of a city. Increase in collection of Value-added tax (VAT) or
Goods and services tax is a proxy for improvements in trade and services in the
city.
·
Increase in issuance of Construction
Permit: This is one of the important indicators of economic
productivity and competitiveness of a city. Increases in issuance of
construction permits indicates improvements in the construction/real estate
sector in the city.
· Unemployment
rate: Employment generation is one of the key channels
through which economic growth translates into prosperity for the population.
Unemployment rate of a city denotes the proportion of work force in a city that
is not engaged in gainful employment or economic activity.
4)
Physical
a)
Housing
· Percentage
of Slum/EWS households covered through formal/affordable housing:
The extent to which slum households have been provided formal housing through
redevelopment projects, and EWs households have been covered through various affordable
housing projects and schemes.
b)
Public Open Spaces:
· Per
capita availability of green spaces: The extent to which
urban greens and open spaces such as recreational spaces, organized greens and
common spaces like flood plains, forest cover, vacant lands etc. are available
in the city leading to a better urban environment.
· Per
capita availability of public and recreational places:
This indicator denotes the extent to which recreational and public spaces are
available in the city for recreation, social interaction and active physical
activities. such spaces can include playgrounds, stadiums and sports complexes,
city and district parks, neighbourhood parks etc.
c)
Mixed Land Use and Compactness:
· Share
of mixed land use area in overall city land use:
This indicates the proportion of areas in the city which have been developed as
multifunctional zones, i.e. areas where residential, commercial and
non-polluting industrial activity/ service industry are planned in close
proximity to one another as an integrated mix.
d)
Power Supply:
· Total
energy consumption per capita: This denotes the per
capita energy consumption by residential, commercial and industrial users in
the city. This is an important indicator that can be used by cities to plan
various conservation and efficiency-related interventions for optimizing energy
use.
·
Percentage of new and redeveloped
buildings following green building norms: The extent to which new
developments and redevelopments have adopted green building norms and have received
GRIHA leading to reduction in overall energy consumption.
· Percentage
of total energy derived from renewable sources:
The extent to which energy demand is met from non-conventional energy sources
such as solar energy, wind energy etc. thereby reducing the dependence on
energy produced through non-renewable sources.
e)
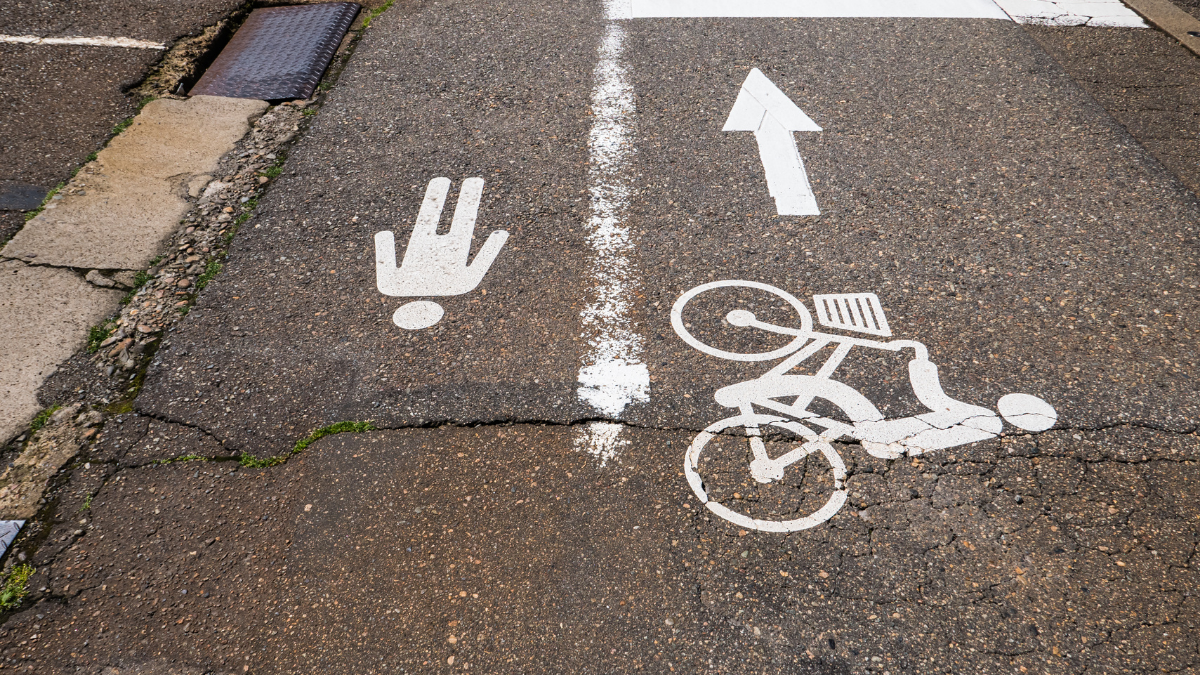
Transportation and Mobility:
· Availability
of public transport: This denotes the availability of public
bus or rail transport in the city, in proportion to the population of the city.
· Percentage
of road network with dedicated bicycle tracks:
This denotes the availability of dedicated Right of Way for bicycles in the
city, thereby encouraging the use of such non-polluting transport options.
· Mode
share of non-motorised transport: This denotes the extent
to which people walk or use bicycles and cycle rickshaws for moving within the
city.
·
Percentage coverage of footpaths –
wider than 1.2m
· Availability
of paid parking spaces: This is indicative of the
restriction on free parking spaces for all vehicles in a city.
f)
Assured Water Supply:
· Household
level coverage of direct water supply connections:
The extent to which households in the city are connected to the water supply
network with a direct service connection, as percentage of total number of
households. Household level water supply connection i.e. direct piped
connection, is the minimum acceptable standard for water supply service.
·
Quality of water supplied: This
denotes the quality of water supplied to citizens, as per specified potable
water standards. This is an important aspect, since poor water quality can pose
serious public health hazards.
·
Per capita supply of water: Per
capita water supplied, indicates the adequacy of the municipal water supply
system to source adequate raw water, treat water to potable standards and
supply the same into the distribution system.
· Percentage
of water connections covered through meters
·
Percentage of plots with rainwater
harvesting facility
g)
Waste Water Management
· Coverage
of toilets: The extent to which citizens have access
to individual or community toilets in the city.
·
Coverage of sewerage network and/or
septage: Denotes the extent to which waste water management
facilities are available to individual properties across the city, whether
through centralized underground sewerage, decentralized systems or on-site
systems such as septic tanks.
·
Extent of reuse and recycling of
waste water: This denotes the proportion of waste
water received at the treatment plant that is recycled or reused for various
purposes.
·
Coverage of storm water drains
h)
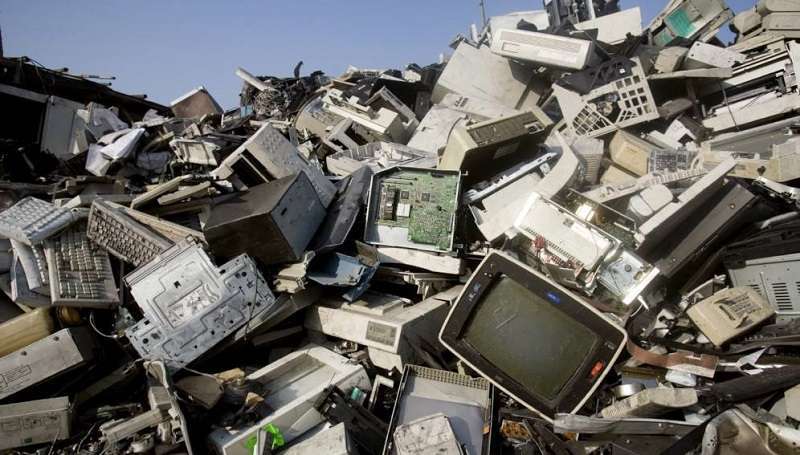
Solid Waste Management:
· Household
level coverage of municipal solid waste collection: The
extent to which households and establishments in the city are covered through
door-to-door collection of municipal solid wastes on a daily basis.
· Extent
of municipal solid waste recovered through reuse:
The extent to which municipal solid waste generated in the city is either
recycled or processed through centralised and decentralised recycling
processes.
The city planners need to focus on
achieving this Liveability standards by Government of India in order to make
cities more liveable by adopting the policies, schemes and development control
regulations and increase the standard of living of citizens. In 2019 the list
of liveable Indian cities were declared by government based on the liveability
standards, following are some examples:
1)
Hyderabad, Andhra Pradesh (Ranks 1st): A
densely populated metropolitan city with people bustling in and out of cafes,
offices, temples and even nowhere, Hyderabad is fast turning into the New York
city of South India. Ever heard of a place where its population and companies
are evenly distributed to provide hassle-free life with less congestion and
traffic. Apart from all this, the city is also emerging as an IT hub with a
top-class airport and international schools.
2) Bangalore, Karnataka- Start up city of
India (Ranks 2nd): Having evolved
gradually from being the Garden City to the Silicon Valley of India, Bengaluru
is India's third-largest city, being the second most liveable city in India.
Also known as the IT hub of India, Bangalore is home to leading start-ups. Ever
wished to live in a city that's best for work-life balance, entertainment,
shopping, travel, art & culture, food, and of course, pleasant weather.
3)
Chandigarh, Punjab- India’s First planned city (Ranks 3rd): Designed
by the ace architect Le Corbusier consisting of 47 self-contained sectors,
India's first planned city is known for its unique blend of urbane architecture
and natural bliss. Also called as the greenest city in India, Chandigarh is
home to beautiful gardens and park in every sector. The roads are well
maintained making commuting much safer and more accessible.